Misleading Conclusions Based on Statistical Significance and Non-significance at a Recent International Conference Will G Hopkins Sportscience 25, 1-9, 2021 (sportsci.org/2021/NHSTmisuse.htm)
|
||||||||
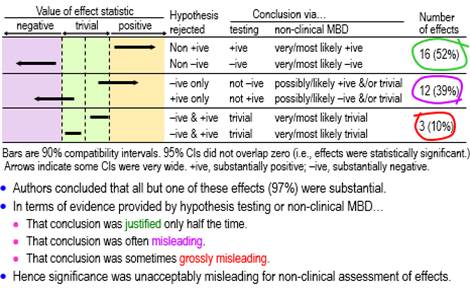
RationaleIn my report on presentations relevant to athletes at the annual conference of the European College of Sport Science (ECSS) last year, I noted that "almost everyone has scuttled back to nil-hypothesis significance testing (NHST) and its misinterpretations, following the attacks on magnitude-based inference (MBI)" (Hopkins, 2020b). In this article I have quantified the misinterpretations by using better ways than statistical significance and non-significance to deal with the uncertainty arising from sampling variation. How should we interpret statistical significance and non-significance? Sander Greenland (personal communication) has offered the following… "One correct interpretation of statistical significance is that the data are not very compatible with the statistical model used to derive the test, according to some conventional criterion (usually that the P-value from the test is below 0.05). The corresponding interpretation for non-significance is that the data are fairly compatible with that model according to the criterion (Rafi & Greenland, 2020). A significant test suggests something is wrong with one of the assumptions built into the model; usually that is taken to mean that the assumption of no effect is wrong, but some other problem might be responsible for the discord between the data and the model. In contrast, a non-significant test merely means that no problem was detected–but not that there is no problem, and in particular not that there is no effect. And there is no correct plain-language interpretation–that's been the problem since the 19th century." These correct interpretations do not seem to me to be particularly useful, in that they do not directly address the issue of the magnitude of the effect in a clinical, practical or theoretical sense. This is surely the issue we should address when we investigate effects in samples. Most researchers would probably agree, because they appear to interpret significant as important or substantial and non-significant as unimportant or trivial (or even as no effect whatsoever). I am not aware of any research aimed at quantifying these interpretations in any scientific discipline, so the first aim of the present study was to determine the proportions of significant and non-significant effects that researchers presented at the ECSS conference as substantial and trivial. Whether these interpretations of statistical significance and non-significance were correct is impossible to assess, because we cannot know the true values of the effects in the populations from which the samples were drawn. However, the interpretations can be deemed either justified or misleading, in the light of better evidence about importance than what is provided by statistical significance and non-significance. For those who subscribe to a Popperian philosophy of science, evidence is provided by disproving things, hence the notion that you need to reject (disprove) hypotheses about effects in samples. Rejecting the hypothesis that an effect is not substantial represents evidence that the effect is substantial. But substantial has a positive and negative sense, which is easy to understand if the effect has clinical relevance: it could be beneficial or harmful. Rejecting the hypothesis that the effect is not substantial in one or other of the two senses is an approach known as minimum-effects testing (e.g., Lakens et al., 2018). The appropriate hypothesis to reject for evidence that an effect is trivial is the hypothesis that the effect is substantial. Here there are also two hypotheses–the effect could be substantial in a positive or negative sense–but now both hypotheses have to be rejected. This approach is called equivalence testing, a term arising from testing the difference between two treatments: if the difference is trivial, then the treatments are equivalent (e.g., Lakens et al., 2018). My second aim was therefore to assess the statistically significant and non-significant effects at the ECSS conference with the hypothesis tests of minimum-effects and equivalence testing. Greenland's concerns about the interpretation of the nil-hypothesis test apply equally to minimum-effects and equivalence testing. For example, an effect could be harmful, yet rejection of the hypothesis of harm could occur because of violation of one or more of the many assumptions about the data and statistical model underlying the hypothesis test (Greenland & Rafi, 2021). The evidence provided by the p values of the hypothesis tests is conditioned on the assumptions. As such, the evidence addresses only the issue of uncertainty in the estimate of the effect arising from sampling variation: the expected variation if the study was repeated with similar random samples. In the current study, I have assessed the outcomes with hypothesis tests by accounting only for sampling uncertainty. Magnitude-based inference (MBI) is another approach to accounting only for sampling uncertainty when assessing magnitudes of effects. MBI arose from a Bayesian interpretation of the sampling distribution promoted earlier by others (Burton, 1994; Shakespeare et al., 2001), and it was shown to have acceptable error rates in a comprehensive simulation study (Hopkins & Batterham, 2016). Nevertheless Sainani (2018) and Sainani et al. (2019) claimed that MBI had unacceptable error rates and lacked a theoretical basis. In response to the criticism, I showed in an article at this site that MBI is equivalent to minimum-effects and equivalence testing, with acceptable alphas for the hypothesis tests and therefore acceptable error rates (Hopkins, 2020a). In another article at this site I provided further evidence that MBI has a valid Bayesian basis, by showing that the probabilities of substantial and trivial magnitudes in MBI are practically identical to Bayesian posterior probabilities when there is a realistic weakly informative prior (Hopkins, 2019c). The Bayesian interpretation is particularly useful, since it communicates sampling uncertainty in an accessible nuanced fashion and thereby avoids the strict dichotomization implicit in hypothesis testing. For these and other reasons I changed the name of MBI to magnitude-based decisions (MBD) (Hopkins, 2019b). My final aim was to use MBD to assess the significant and non-significant effects at the ECSS conference. MethodsI obtained data for this study by working through the abstracts and videos of the presentations I summarized in the report (Hopkins, 2020b) on the 2020 ECSS virtual conference, in the order shown in the report, until I had obtained an indicative sample of presentations. I stopped after analyzing all the presentations in the sections on acute effects, injury risk, injury recovery, and nutrition that contained at least one significant or non-significant effect, a total of 33 presentations; of these, 32 contained at least one significant effect and 27 contained at least one non-significant effect, with totals of 86 significant and 72 non-significant effects. For the first aim, I deemed significance (NHST p<0.05) to be presented as substantial and non-significance (NHST p>0.05) as trivial, when the authors associated significance and non-significance respectively with an unequivocal statement that there was an effect (e.g., "this study showed that mental fatigue had an effect on tackle technique in rugby union players") and that there was no effect (e.g., "no effect for the upper body (p=0.27)"). For the second aim, I had to specify smallest important values for each effect to divide the effect magnitude into substantially negative, trivial and substantially positive values. Standardization, achieved by dividing a difference or change in means by an appropriate between-subject SD, is the fall-back approach to smallest importants when a continuous dependent variable has no quantified relationship with health, wealth or performance (Hopkins, 2019a); for these effects (usually presented by authors as "effect size", "ES", or "Cohen's d"), I assumed a smallest important of ±0.20. For effects directly related to performance of athletes competing for a best time or distance, I ignored any ES provided by the authors and used instead a smallest important defined by ±0.3 of competition-to-competition within-athlete variability of top athletes in the given sport, which would result in winning or losing one extra medal in every 10 competitions for such athletes (Hopkins et al., 2009; Malcata & Hopkins, 2014). For effects on injury incidence, no authors provided smallest importants; I assumed that a hazard ratio of 0.90 and its inverse 1.11 represented smallest important reductions and increases in injury risk, respectively, because these would result in one athlete in 10 being affected by a risk factor (Hopkins, 2010). I performed hypothesis tests by inserting the smallest importants, the observed value of the effect, and the p value provided by the authors for the nil-hypothesis test into the spreadsheet for converting p values to MBD (Hopkins, 2007). If the authors provided only "p<0.05" or "statistically significant", I assumed p=0.05. If the authors stated compatibility limits or interval for an effect instead of a p value, I used the spreadsheet to combine/compare effects (Hopkins, 2006). When divided by 100, the chances of substantial effects in both spreadsheets are p values of the tests of substantial hypotheses (p+, p–), and 1 minus these p values are the p values for the tests of the non-substantial hypotheses (pN+, pN–) (Hopkins, 2020a). I assessed an effect as decisively substantial if a non-substantial hypothesis was rejected with an alpha of 0.05 (pN+<0.05 or pN–<0.05); effects were decisively trivial if both substantial hypotheses were rejected with alphas of 0.05 (p+<0.05 and p–<0.05). The spreadsheets also provided MBD for the third aim. Non-clinical MBD is equivalent to tests of non-substantial and substantial hypotheses with alphas of 0.05 (Hopkins, 2020a): very likely substantial was decisively substantial (p+>0.95 or p–>0.95, i.e., pN+<0.05 or pN–<0.05), and very likely trivial was decisively trivial (pT >0.95, which is slightly more conservative than rejection of both substantial hypotheses, p+<0.05 and p–<0.05). Failure to reject any hypotheses was deemed an unclear outcome, and when only one substantial hypothesis was rejected, the chances of the other magnitude and the chances of a trivial magnitude were interpreted qualitatively as possible or likely, where relevant. For clinical MBD, the alphas for the tests of harm and benefit were 0.005 and 0.25, respectively (Hopkins, 2020a). Potentially implementable effects were those where harm was rejected and benefit was not rejected (pH<0.005 and pB>0.25; most unlikely harmful and at least possibly beneficial). With the odds-ratio version of clinical MBD, an otherwise unclear effect was deemed potentially implementable, if the ratio of odds of benefit to odds of harm was >66. Excel spreadsheets with details of each presentation are available on request. The presentations are identified by the first author's family name and initial, which can be used to access the abstract of the presentation via the search engine at the conference site. My interpretation of effects in the abstracts can therefore be verified. Unfortunately, the videos are no longer available, so for effects I have stated as being only in the video, you will have to contact the author for verification. Uncertainty (90% compatibility limits) in the proportions of effects were calculated from the normal approximation of the binomial distribution and are expressed in approximate ± form. For proportions approaching 100%, the upper limit sometimes exceeds 100% and can be regarded as effectively 100%. ResultsThere was an unequivocal statement that a significant effect was substantial in 28 of the 32 presentations. Of the remaining four, one author (Burke, L.) commendably interpreted a significant effect as trivial by considering its observed magnitude ("from a statistical standpoint, ad-lib [feeding] results in better endurance performance; however, from a practical perspective, both strategies are expected to have a similar effect"). One of the remaining three presentations had no significant effect; in all three, at least one non-significant effect was stated to be trivial, so it is reasonable to assume that the authors would have assessed their significant effects as substantial. Thus, at a minimum, 28/31 (90%, 90% compatibility limits ±9%) and more likely 31/32 (97%, ±5%) of authors regarded significant as substantial. Of the 27 presentations containing at least one non-significant effect, six did not have interpretations of non-significant effects; of the remaining 21, two contained assertions that non-significance represented a "trend", one interpreted p=0.052 and p=0.053 as substantial effects (but also interpreted effects with larger p values as trivial), and 20 of the 21 contained assertions that non-significant effects were trivial. Thus a minimum of 20/27 (74%, ±14%) of authors interpreted non-significant as trivial. Conclusions for the effects with sufficient data to assess magnitudes with p values for substantial and non-substantial hypothesis tests and the corresponding MBD are shown in Figures 1-4, which are taken from the slideshow accompanying this article. The figures illustrate the disposition of representative compatibility intervals for the rejected hypotheses. View the slideshow to see the figures animated, which should facilitate understanding. As shown in Figure 1, only about half the assessable statistically significant effects (52%, 90% compatibility limits ±15%) were decisively substantial (rejection of a non-substantial hypothesis; very likely or most likely substantial in non-clinical MBD), one-tenth (10%, ±9%) were actually decisively trivial (rejection of both substantial hypotheses; very or most likely trivial), and the remainder (39%, ±14%) were possibly or likely substantial or trivial. None was inconclusive or unclear (failure to reject both substantial hypotheses, i.e., an effect compatible with substantial positive and negative values).
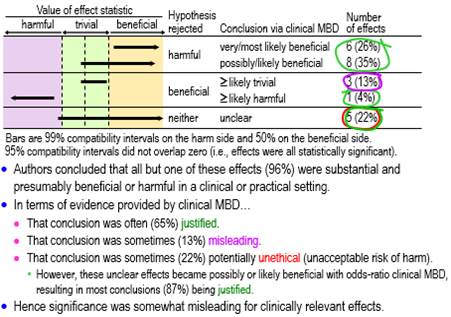
Figure 2 shows conclusions for the statistically significant clinically relevant effects using tests of harmful and beneficial hypotheses appropriate for clinical MBD. About three-fifths (61%, ±17%) qualified as potentially implementable (at least possibly beneficial), one sixth (17%, ±13%) were decisively trivial or potentially harmful, and the remainder (22%, ±14%) were unclear (failure to reject benefit and harm, i.e., an effect compatible with benefit and harm). A conclusion of substantial (and therefore beneficial) with the latter is potentially unethical, because a practitioner could end up implementing a potentially harmful effect. However, in this particular sample, all these unclear effects had such a low risk of harm and high chance of benefit that they became potentially implementable when assessed with odds-ratio MBD. Most conclusions (87%, ±12%) based on significance were therefore justified when assessed with this less-conservative version of clinical MBD.
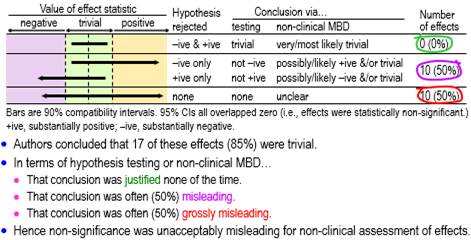
Figure 3 shows conclusions for all the assessable non-significant effects using hypothesis tests and non-clinical MBD. None of these effects was decisively trivial (rejection of both substantial hypotheses, i.e., very or most likely trivial in non-clinical MBD), one-half (50%, ±18%) were possibly or likely substantial or trivial, and the other half (50%, ±18%) were unclear.
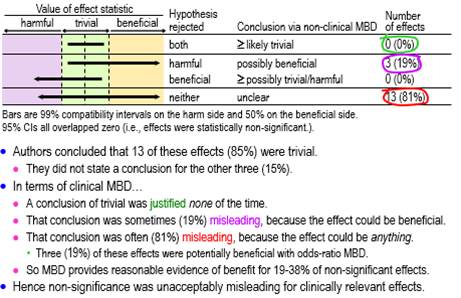
Conclusions based on clinical MBD for the clinically relevant non-significant effects are summarized in Figure 4, which show that about one-fifth (19%, ±16%) were possibly beneficial, and the remainder (81%, ±16%) were unclear. Some of the unclear effects (about one-fifth of the total: 19%, ±16%) became potentially implementable with odds-ratio MBD, making a total of about two-fifths (38%, ±20%) potentially implementable.
DiscussionAddressing my first aim, authors of almost all of a sample of presentations at the ECSS conference interpreted significant effects as substantial, and three-quarters of authors interpreted non-significant effects as trivial. When I assessed the effects with tests of non-substantial and substantial hypotheses for my second aim, these interpretations were justified for little more than half the significant effects and for none of the non-significant effects. Combining these outcomes, around half of the significant effects and three-quarters of the non-significant effects were presented in a misleading fashion. The proportions of effects are based on a relatively small sample size and therefore have considerable uncertainty. Nevertheless, with the possible exception of clinically relevant significant effects, the proportions represented by the compatibility limits allow the conclusion that the nil-hypothesis test led to an unacceptable high prevalence of misleading conclusions about effect magnitudes at this conference. It seems unlikely that authors would change their interpretations when submitting their studies for publication, and in my experience, there is a similar high prevalence of misinterpretations in studies of athletic and non-athletic populations in the journals of the sport and exercise sciences. The differences in proportions of misleading conclusions between significant and non-significant effects are due partly to sample size. With a small-enough sample size, the resulting wide compatibility interval of a non-significant effect cannot fall entirely in trivial values, so the conclusion of a trivial effect must always be misleading; however, a compatibility interval of a significant effect with a small sample size may fall entirely in substantial values or partly in beneficial values, in which case the conclusion of a substantial or beneficial effect is justified. With a large-enough sample size, the compatibility interval of a non-significant effect will always fall entirely in trivial values, so the conclusion of a trivial effect will never be misleading; however, the compatibility interval of a significant effect may fall partly or entirely in trivial values, in which case the conclusion of a substantial or beneficial effect will be misleading. Evidently the sample sizes of the studies I have analyzed here tended to be small. Statistical significance interpreted as substantial in a clinical sense was less misleading than in a non-clinical sense, apparently because of small sample sizes in the majority of presentations: the consequent wide compatibility intervals allowed many significant effects to have a reasonable chance of benefit with a sufficiently low risk of harm for the effects to be potentially implementable. Non-significance interpreted as trivial was more problematic for clinically relevant effects, because the wide compatibility intervals arising from the small sample sizes resulted in mainly unclear outcomes, while the remainder were potentially implementable. MBD provided probabilistic assessments of magnitude that are consistent with minimum-effects and equivalence testing, but MBD surpasses the hypothesis tests by providing accessible, nuanced probabilistic assertions about magnitude, especially when only one substantial hypothesis was rejected. The clinical versions of MBD, in particular, provide the researcher with evidence of implementability of an effect when the hypothesis of harm but not of benefit has been rejected (pH<0.005, pB>0.25; most unlikely harmful, at least possibly beneficial). Interestingly, the significant effects for which both the beneficial and harmful hypotheses were not rejected (unclear in MBD) all became potentially implementable with the odds-ratio version of clinical MBD, which appears to make this version of MBD almost as misleading as statistical significance. The difference is that odds-ratio MBD, as with the other versions of MBD, presents outcomes as possibly or likely beneficial, rather than dichotomized significant or not; furthermore, if an unclear effect becomes potentially implementable with odds-ratio MBD, the researcher or practitioner ought to be aware of the increased risk of harm. One way to avoid misinterpretations of significance and non-significance is simply to state whether or not the effect is significant, without making any further conclusion about the magnitude beyond whether or not the effect could be zero. Some of the six presenters who did not interpret their non-significant effects may have adopted this strategy, especially if they knew enough about sampling uncertainty to understand that non-significant effects are problematic with small sample sizes (Hopkins & Batterham, 2016). I do not recommend this strategy, because it does not address the question of whether or not the effect is important, and the majority of readers will likely make the same misinterpretations of significance and non-significance as the majority of presenters at the ECSS conference. Another way to avoid the misinterpretations is to present the significance or non-significance but to base interpretations of magnitude either on minimum-effects and equivalence testing or on MBD. I also advise against this strategy, because the majority of readers will probably regard a significant effect as "real", a non-significant effect as "no effect", and discount the other interpretations. Researchers should also understand that the problem of misinterpretations with significance and non-significance is not solved by using the sample size estimated with a power calculation. With such a sample size, an effect with an NHST p value in the vicinity of 0.05 must have a compatibility interval that overlaps trivial and substantial values. It follows that neither substantial nor non-substantial hypotheses can be rejected, so a conclusion that the effect is trivial (when p>0.05) or substantial (when p<0.05) has to be misleading. This insight represents further evidence supporting the call by Greenland and his colleagues to retire statistical significance (Amrhein et al., 2019). More recently, Greenland has argued even against the dichotomization implicit in hypothesis testing, opting instead for qualitative descriptions of compatibility or incompatibility of an effect magnitude with the data, statistical model, and all underlying assumptions (Greenland & Rafi, 2021; Rafi & Greenland, 2020). The range of compatible values is represented by the compatibility (formerly confidence) interval, and the compatibility with hypothesized values is summarized by a p value or S value (the number of consecutive heads in tossing a coin that would have the same p value). It remains to be seen whether the use of S values would lead to greater understanding, clarity and skepticism on the part of researchers in their presentations of effects in samples. In MBD, the p values of the hypothesis tests of substantial and non-substantial magnitudes are interpreted quantitatively and qualitatively as the probabilities that the effect has the hypothesized magnitudes (Hopkins, 2020a; Hopkins & Batterham, 2016), which seem to me to be more accessible than S values as a way for researchers to avoid dichotomization and instead weigh the evidence for and against effect magnitudes. Whichever approach researchers use, they should state clearly that a conclusion, decision or probabilistic statement about the magnitude of an effect is based on the uncertainty arising from sampling variation and is conditioned on assumptions about the data and the statistical model used to derive the compatibility interval and associated p values. The way in which violation of these assumptions could bias the outcome should be discussed and, where possible, investigated quantitatively (e.g., Lash et al., 2014). A straightforward method is sensitivity analyses, in which the width and disposition of the compatibility interval relative to smallest importants are determined for realistic worst-case violations. The smallest importants are themselves candidates for a sensitivity analysis. ReferencesAmrhein V, Greenland S, McShane B. (2019). Retire statistical significance. Nature 567, 305-307. Greenland S, Rafi Z. (2021). To aid scientific inference, emphasize unconditional descriptions of statistics. arXiv.org, https://arxiv.org/abs/1909.08583. Hopkins WG. (2019b). Magnitude-based decisions. Sportscience 23, i-iii. Hopkins WG. (2020a). Magnitude-based decisions as hypothesis tests. Sportscience 24, 1-16. Acknowledgements: Thanks to the reviewers and to Sander Greenland for identifying misconceptions and suggesting improvements. Published June 2021 |