| A
New View of Statistics |
|
|
This
image has active links: 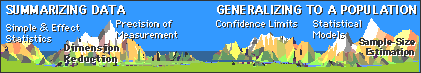 |
|
|
|
Nov 2016. These pages need updating, especially those dealing with magnitude thresholds. Meantime please use the links in the right-hand frame to peer-reviewed articles and slideshows on statistics at Sportscience. Previous
updates... |
| New original approaches to statistics for researchers: the examples are taken from exercise and sport science, but the principles apply to all empirical sciences. Read more in the preface. |
| Feedback wanted: if you can't understand something here, it's my fault. Email me. |
| Become a license holder...eventually! Not yet. More... |
Full Contents
Short Contents:
Preface: About These Pages
Summarizing Data
Simple Statistics & Effect Statistics
Dimension Reduction
Precision of Measurement
Generalizing to a Population
Confidence Limits & Statistical Significance
Statistical Models
Estimating Sample Size
Summary: The Most Important Points
Quiz
Reference: Hopkins, W. G. (2000). A new view of statistics. Internet Society for Sport Science: http://www.sportsci.org/resource/stats/.
If you are viewing this page without a navigation/index frame on the left, click here.
Go to: Preface · Contents · Start of Text · Search · Home
UPDATES
2013
May. Coming very soon: a slideshow and Excel workbook for an introductory course of 10 lectures on statistics. Actually it is available. Contact me.
2011
Aug. Check out the following 2010 articles at Sportscience: assigning subjects to treatments in a controlled trial; regression vs limits of agreement in measure-comparison studies; magnitudes of effects derived from linear models. See the frame at right for links to much more, including the progressive statistics and research design articles..
2009
Dec 8. Progressive statistics now available as a complete updated article.
May 23-29. Much improved reliability spreadsheet.
May 17. A spreadsheet for the intraclass correlation coefficient, and some updating of page on reliability calculations.
May 16. Progressive Statistics Updated in Sportscience 2009 for more information on a complete guide to statistical analysis and presentation.
April 9. Sorry, folks, I continue to neglect these pages in favor of peer-reviewed articles at. See the 2008 In-Brief column for a comprehensive slideshow on statistical guidelines and an article in the same issue on research designs.
2008
June 15. Frame added at right for easier access to main stats resources. Zipped copy of these pages no longer available, because there are too many good resources at Sportscience.
Jan 4. See 2007 issue of Sportscience for learning stats with spreadsheets, clinical and mechanistic inferences via p values, a new spreadsheet for comparing group means, and sample-size updates. For history of previous updates, see below.
2007
Nov 18: Fixed error in formulae for adjusting to value of covariate in the repeated-measures (controlled-trials) spreadsheets. Retirement looms...
Oct 21: Tweaked the bootstrapping example.
Oct 14: Spreadsheet for confidence limits now generates customizable clinical and mechanistic inferences.
Jan 4: Papers and spreadsheets for analysis of controlled trials, combining independent estimates, and estimation of sample-size in the 2006 issue of Sportscience. Other useful stats stuff in the In-brief section there, too.
2006
Oct 8: Minor additions to validity spreadsheet.
Aug 7: New way of justifying thresholds for magnitudes of standardized differences in means.
July 5: Latest sample-size resources at sportsci.org/2006. I will update the pages here eventually.
May 12 : Error in ICC formulae now corrected in spreadsheet for reliability. Sorry about that, folks.
Mar 22: Spreadsheet for reliability now has stats averaged over multiple trials.
2005
Dec 16: Updates long overdue. Meanwhile check Sportscience for articles on magnitude-based inferences, controlled trials, meta-analysis, interpreting test results, and a critique of Bland-Altman validity.
June 25: Validity spreadsheet now has confidence limits for parameters of calibration equation.
June 2: Corrected residuals in log section of validity spreadsheet.
2004
Aug 19: Info about generalized linear modeling for variables representing counts and proportions.
2003
Nov 1: Article and spreadsheets for analysis of straightforward controlled trials, crossovers, and time series.
Oct 10: Adjustable level for confidence limits added to reliability and validity spreadsheets.
June 25: Minor improvement to Mean ± SD or Mean ± SEM?
June 15: Correcting change scores and other updates of regression to the mean.
June 8: Slideshow on repeated measures. Tweaking of categorical modeling and most pages on repeated measures. New section on repeated measures with troublesome variables.
Mar 9: More on uniformity of residuals, especially in complex models, and more on Cohen effects via rank transformation.
Jan 31: Spreadsheet for assessing an individual now includes qualitative clinical chances.
Jan 23: Confidence limits as ± and x/÷ added to spreadsheet.
Jan 16: Minor tweaking of transformations for counts and proportions. Caution about back-transformed means.
2002
Dec 4: Clinical/practical significance updates of spreadsheet now complete.
Nov 3: probabilities of clinical/practical significance added to spreadsheet.
June 29: Clinical vs statistical significance: Powerpoint presentation and link to new article.
June 4: Powerpoint presentation on covariates in repeated-measures analyses. Update of controlling for something, and a new section on mechanism variables and confounders.
May 6: Clearer explanations of transformations for counts and proportions. Minor tweaking of scale of effect magnitudes.
Apr 29: Regression to the mean.
Apr 28: Confidence limits for relative risk and odds ratio included in spreadsheet.
Mar 16: Corrected interpretation of odds ratio.
2001
Dec 28: Clinical vs statistical significance, and updated spreadsheet for likelihoods of clinically important effects.
Aug 20: An exact new-prediction error to replace the PRESS-derived statistic; spreadsheets for validity studies and assessing an individual updated accordingly.
Aug 5: Clarification of sample size based on confidence limits. Minor updates of sample size estimation and applications of reliability.
Jun 4: Powerpoint presentation on reliability and some of its uses. Update of monitoring for a change in an individual. Update of spreadsheet for monitoring/assessing individuals, including (for what it's worth) Bayesian adjustment.
Mar 26: More on degrees of freedom.
Mar 3-4: Calculation of confidence limits and p values, including effects of violations of independence of observations, normality of sampling distribution, and uniformity of residuals. Definition of degrees of freedom. More on t tests with unequal variances. Substantial changes to log and rank transformation, and ordinal and count dependent variables.
Mar 2: Simple way to estimate practice effect in a crossover.
Mar 1: Variables representing counts.
2000
Dec 17-19: Counts and proportions as dependent variables, including binomial and Poisson regressions, square-root and arcsine-root transformations.
Dec 10-11: Standardized regression coefficient. More on goodness of fit, t test, difference in means, relative frequency, polynomial coefficients and bad residuals.
Dec 3-5: Use of � and �/÷ with typical error. More on log transformation.
Sept 11-12: More on using reliability to estimate sample size and assess an individual (plus an upgrade of the spreadsheet).
Aug 11: Very cool Google search form added.
Aug 4: Fixed missing-value bug in log plots in reliability spreadsheet.
June 29: More on Type O error and one-tailed tests.
June 24: Search form added.
June 18: A reprieve for one-tailed tests, sort of.
June 15-22: Major revisions/new pages for precision of measurement: measures of reliability, applications of reliability, measures of validity and applications of validity, plus a spreadsheet for precision of assessment of individuals.
June 4: Update of validity, including an improvement on the PRESS statistic and a spreadsheet to analyze simple validity studies.
Apr 15-18: Bayesian analysis, and definitions of probability.
Mar 31: Type 0 error and cumulative Type 0 error.
Mar 28: Update and simplification of reliability calculations, plus a spreadsheet!
Mar 27: Update of sample-size estimation, and definition of concurrent reliability.
Mar 26: Rewrite of confidence intervals and statistical significance, and a cool way to interpret the p value.
Feb 7: Review of this site and other stats sites at BioMedNet.
1999
June 17: More on interpreting sex in a two-way ANOVA. New section on sex in repeated measures.
May 27: Slideshow on confidence limits.
May 22: New features in spreadsheet for confidence limits (ratio of standard deviations, and Tate & Klett adjustment for standard deviations).
1998
Dec 6: Tidy-up of reliability, reliability calculations, validity, and log transformation. Definition of covariance.
Nov 20: Using the ± sign to represent a confidence interval. See the example.
Sept 12: How to calculate confidence limits from a p value, and a downloadable spreadsheet to do it.
June 15: Updated Proc Mixed and added individual differences, and covariates.
June 14: Plain-language definitions of confidence interval and statistical significance.
May 11: Using proc mixed in SAS for repeated measures.
Mar 29: Swapped axes in validity figure. (Silly mistake!)
Mar 12: Note about checking the fit of non-linear models.
Mar 8: Major revision of validity to give equal emphasis to systematic offset, standard deviation of the estimate, and validity correlation.
Mar 8: Figure to show why not to use SEMs.
Feb 19: Warning about specifying complex covariance structures with multiple crossovers.
Jan 15: Reliability completely revised to give equal emphasis to shift in the mean, within-subject variation, and retest correlation. Minor changes to related pages. Spreadsheet for confidence intervals for reliability also now available.
1997
Nov 28: Latin squares to assign subjects in multiple crossovers.
Nov 18: Multiple crossovers for experiments with several treatments.
Nov 17: A small change in the way of representing the subject effect in repeated-measures models.
Sept 8: How to analyze crossovers to account for any learning effect.
Sept 7: Random vs fixed effects explained.
Sept 5: Better explanations for calculating estimates and contrasts in various models.
12 June: Multiple linear regression improved.
10 June: Substantial revision of a scale of magnitudes for effect statistics.
06 June: Reworked sample size for complex cross-sectional studies.
05 June: Made p values and type II errors more understandable.
04 June: Sample size with more than one independent variable.
02 June: Major additions to Sample Size "On The Fly", including simulation programs.
28 May: Sample-size formula corrected to 2N(1 - r).
14 May: Sample-size estimation expanded.
13 May: Bootstrapping expanded.
13 May: Argument against adjusting confidence intervals and p values when reporting several effects.
12 May: First public release at Sportscience site.
10 May: r=0.1 as a small effect, in terms of change in X => change in Y.
10 May: Need to view SDs to decide whether to transform data: argument added to Mean ± SD or Mean ± SEM?
09 May: Argument against the notion of testing contrasts only if main effect is significant.
07 May: Release to acsmstats group.
01 May: First release to colleagues.